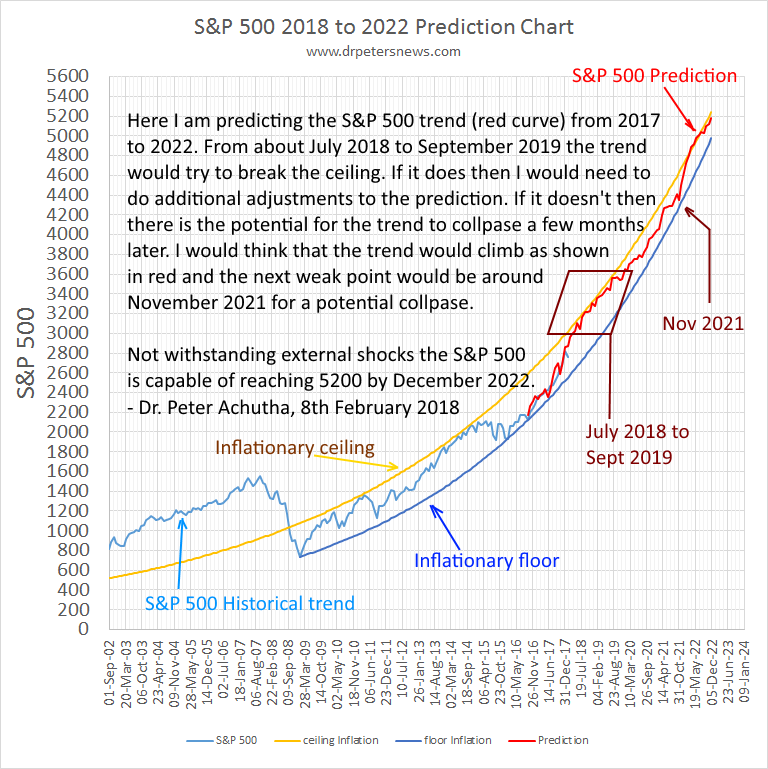
The S&P 500 trend until 2022 
Having published the NYSE and DJI predictions I decided to examine the NASDAQ and the S&P 500 trends. It took me some time to do this chart. I did not expect it to be that difficult. As of today 8th February 2018 I am publishing this chart and do hope the prediction is good indication of how the S&P500 will move until 2022.
I do not like to use the term forecasting as it sounds like an estimate and vague. I prefer to use the term predicting as I am trying to do something that hopefully is relaible, useful and clearly shows the fututre trends.
I downloaded the data from Yahoo Finance at https://finance.yahoo.com/quote/%5EGSPC/history?period1=-315648000&period2=1518019200&interval=1mo&filter=history&frequency=1mo
There is an inflationary ceiling of about 8.5% and an inflationary floor of about 8.23%. Hence the S&P 500 trend is range bound within this floor and ceiling. Should it break the ceiling the upward trend could shoot upward very quickly. Should the trend break the floor it could collapse too. Normally if the trend could not break the ceiling, it would remain range bound or take a few months to hit the floor. When that happens, the S&P 500 trend could collapse to much lower values or bounce back upward.
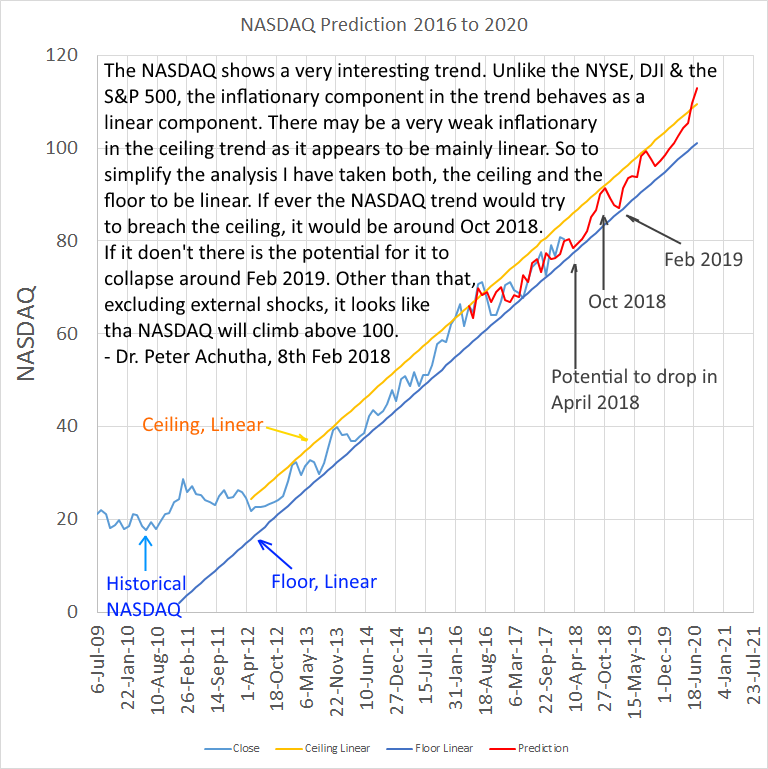
The NASDAQ prediction from 2016 to 2020
I downloaded the NASDAQ data from Yahoo Finance at https://finance.yahoo.com/quote/NDAQ/history?period1=-315648000&period2=1518019200&interval=1mo&filter=history&frequency=1mo.
I had not noticed this type of trend for a very long time. The Inflationary component has been very mild or non-existent and the trend appears to be a very linear upward trend. As a result of this chart I am wondering whether I should change my equation of markets to
M(z) = W(z) + I(z) + L(z) + N(z)
Where L(z) is the linear component or keep it
M(z) = W(z) + I(z) + N(z)
Where I(z) represents both the inflationary component and the linear component.
That is going to be a big decision as I used to joke about my equation as describing how to make money.
M(z) = | There are 3 components or requirements to make money. They are :- |
W(z) = | Working capital. If you do not have sufficient working capital the business will fail easily as many times you need to pay your suppliers before your customers pay you. Rich people will say it stands for workers but with automation and AI less and less workers are required and you would need capital to purchase advanced equipment. |
I(z) = | inventions, ideas, innovations. In a competitive world you have to be the best at what you do. |
N(z) = | News, networks. News of potential customers, promotions and adverts. Networks are the amount of the customers who talk good about your products. |
And the most important quality is zzz that is you and your staff are not sleeping on the job.
Examining the NASDAQ trend chart
Coming back to the NASDAQ trend it looks like the trend will be going upward for a long time, at least until 2020. Just be wary around April 2018 and Feb 2019 where it could collapse below the floor. It is an amzing trend that I had not seen for a very long time. Watch the NASDAQ price rise for a very long time.
A Summary of the potential falls
Both charts show that there are occasions in the future where the trends hit the floor. If there are external shocks at about the same time it will be much easier for the trends to collapse at these points. Other then that these trends should rise for a very long time.
This article on the S&P 500 and the NASDAQ trends was researched and written by Dr. Peter Achutha, 8th February 2018.
Please do show me your appreciation of this article by Buying me a coffee.
And do get the "I Won" t-shirt
|