NYSE trend prediction of January 2013 
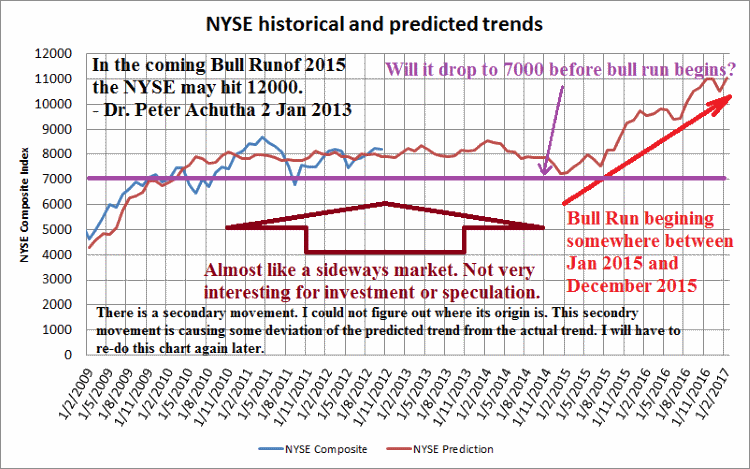
Do you remember in January 2013 I did a chart predicting the NYSE composite index trend? I had predicted a bull run then. The article https://www.drpetersnews.com/nyse-composite-index-prediction-of-2015-bull-run.php was my January 2013 prediction of the NYSE Bull run.
I was predicting it would climb from 8,000 to 12,000. It almost reached 11,000. Well lets be honest, some charts show that the NYSE reached 10,000 where as others indicate that it rose above 11,000. Many published data charts seem to have slightly different trends of the NYSE. So my original data may not be compatible with some of the published charts.
I looked carefully at my predictions and the prediction trend shape was about 6 months earlier than actual trend of the Dow Jones and not the NYSE. How can this be? The only suggestion I have is that since I was predicting a Bull Run to occur on the NYSE by 2015 I believe many traders, speculator and investor pumped money into the NYSE and changed the out come by bring forward the Bull Run. What is truly amazing was that the DOW trend shape, being an index of the NYSE, followed my prediction trend of NYSE -see http://www.macrotrends.net/1319/dow-jones-100-year-historical-chart and view the 10 year trend. And this predicted trend was about 6 months earlier then the DOW trend. Amazing wasn't it? I know that in America in 2013, many people laughed at my NYSE trend prediction, even though they could not make such a prediction themselves. Best yet they had the confidence and trust in my predictions to invest in the NYSE anyway and made the Bull Run appear earlier. I have shown that you can predict the shape of the composite indexes 1 to 3 years ahead of time provided your data is correct and true.
Gold price trend
If you had looked at my previous gold price chart you would have noticed that it was a type of envelop chart in that I had used 1 data point per year to generate the chart. Normally I would use 12 data points, one for each month to generate a predicted price trend chart. I have to do a proper gold chart prediction but I am not sure when I will get round to it. In the end I have decide to let my readers know that gold prices will correct themselves in the long term. That is the prices will fall. There will be upward spikes now and again but in general it will be downwards all the way. I wouldn't be surprised if gold prices falls below $1000/-.
So what do you think of my Alternative Theory of Economics and the mathematical models and the 1 to 3 years predictions of Stock Market Composite Indexes and numerous Commodity price trend prediction since 1998? Don't you think they were very helpful and my work is of Nobel Prize Standard? I seemed to have misplaced my documents on the derivation of my equation D - S = kI. If you have a copy please send me a copy. Thanks.
- Peter Achutha, 13th October 2016
Please do show me your appreciation of this article by Buying me a coffee.
And do get the "I Won" t-shirt
|