Dr. Peter's Financial Systems Blog
Text to search for:
Blog Articles
  • 126. The three virgins
  • 125. My work as an inventor
  • 124. Bad programmers develop email systems at Google
  • 123. Fed & Worldwide interest rate hikes
  • 122. The End of Putin and Russia
  • 121. Disaster in Europe and the end of Ukraine Russia war
  • 120. Is this the end of Ukraine?
  • 119. Proton car salesman
  • 118. Coming worldwide catostrophic diasasters to come
  • 117. President Joe Bideen there is something wrong
  • 116. Does YouTube Malaysia hate non muslims?
  • 115. YouTube increase subscribers and views
  • 114. YouTube is broken
  • 113. open letter to Sundar Pichai, Sergey Brin & Mark Zuckerberg OAuth 2.0 and Contact Us Forms
  • 112. Visions regarding the church and the Chinese
  • 111. The coming worldwide cataclysm
  • 110. President Biden Declares Mass Killings of Armenians a Genocide
  • 109. Checking for clogged arteries
  • 108. President Biden tax revenue from stocks, commodities & forex
  • 107. Thank you President Trump
  • 106. Telecommunications companies billing flaws, bandwidth and other problems
  • 105. President Trump, What has happened to America?
  • 104. Is the China Virus an American Virus?
  • 103. Congratulations to President Elect Biden
  • 102. novel lithium ion battery protection circuit design for longer working life reduce toxic waste
  • 101. Did I cure myself of covid-19 coronavirus?
  • 100. President Trump bless you and recover from the China virus quickly
  • 99. Black lives matter too and so do the lives of the non-Chinese
  • 98. how to overclock cpu with technology that has not been invented yet
  • 97. vaccine lobby conspiracy theory the coming worldwide economic depression
  • 96. laptop refurbished cpu overheating with novel cooling techniques other errors.
  • 95. Letters to President Barack Obama during the great recession of 2008
  • 94. The Cedar of Lebanon is falling. Internet fake news fraud scams and pseudo communist social media companies
  • 93. coconut oil could cure viral diseases coronavirus hiv rubella hepatitis c influenza shingle rabies nipah.
  • 92. YouTube and the death of Western civilization by the coronavirus
  • 91. covid 19 and additional cures and relief for other health problems
  • 90. President Trump infections and the spread of covid-19 until 2024
  • 89. President Trump alternative cures for covid-19
  • 88. President Trump the corona virus and relief from neuropathy nerve pain
  • 87. a potential cure for Covid-19 virus
  • 86. President Trump a potential cure for Covid-19 virus
  • 85. President Trump the effects of the corona virus on the US economy
  • 84. A sad prophecy for Malaysia
  • 83. You are a hero President Trump
  • 82. do not make paul into a god and misunderstanding the laws of Moses.
  • 81. poor protestors rebellion revolution in many countries hong kong bolivia chile peru iraq
  • 80. Star of David Banner
  • 79. Prosperity God Jesus Christ in the churches in malaysia
  • 78. president trump jared kushner $50B palestinian peace plan would not work
  • 77. problems youtube video not showing homemade bread recipe.php
  • 76. php ziparchive not working apache server hard disk full problems
  • 75. LG fridge problems
  • 74. President Trump beware of scams
  • 73. open letter to Sundar Pichai, Sergey Brin & Mark Zuckerberg on proxies, caches and ip addresses
  • 72. open letter to Sundar Pichai, Sergey Brin & Mark Zuckerberg on auctions
  • 71. the tyranny of the turks
  • 70. formulae for Pythagoras Theorem
  • 69. A parallel processing theorem for machine and robotics control
  • 68. Angela Merkel should be nominated for the Nobel Peace Prize
  • 67. Why does the church not want the Ten Commandments?
  • 66. responsive web design for all devices using php superglobal variables
  • 65. We cannot block hackers anymore
  • 64. Books & e-books for sale
  • 63. Comparison of indices DJI, S&P 500, NYSE, NASDAQ and interest rates
  • 62. Predicting the NASDAQ trend from 2016 to 2020 and the S&P 500 from 2017 to 2022
  • 61. Forecasting the NYSE and the DOW Jones Industrial for 2018 to 2022
  • 60. my letters to the prime minister during the 1997 Asian Financial Crisis
  • 59. The way forward
  • 58. Wake up Israel it is time
  • 57. The Calling of the Lord
  • 56. Congratulations President Trump on the bombing of the Syrian military base
  • 55. President Trump and the 7 muslim nations
  • 54. Cure for diabetes and neropathy nerve pain
  • 53. Thank you President Barack Obama
  • 52. healing from ankle and knee joint pain with stem cell products.php
  • 51. Congratulations to President Trump
  • 50. Obamacare
  • 49. High cost of insurance premiums
  • 48. Past predictions and the price of gold
  • 47. Save the children
  • 46. Sino Russian world war and the end of America
  • 45. The Lord Gods blessing and generational curses and gays lesbians
  • 44. Slowing economic growth
  • 43. False teachings in the church in Malaysia
  • 42. Banking problems in Malaysia with AmBank
  • 41. Banking problems in Malaysia
  • 40. Historical-performance-of-my-commodity-price-prediction-charts
  • 39. Major changes to the earths continents to occur if Israel is divided
  • 38. Block hackers bad bots scrappers stop ddos attacks wordpress blog sites
  • 37. China starts world war 3 with rampant piracy and bullying smaller nations
  • 36. Powerful nontoxic insecticide used in my kitchen for exterminating ants
  • 35. Soybean prices forecast chart 2013 2014 2015 2016
  • 34. Palm Oil price trend prediction 2012 2013 2014
  • 33. NYSE Composite Index prediction of 2015 Bull Run
  • 32. Brent-crude-price-forecast-2012-2013-2014
  • 31. Congratulations-President-Barack-Obama
  • 30. Indian stock exchange nifty index prediction chart
  • 29. Soybean prices commodity chart prediction for day traders and others
  • 28. Huduh is not for malaysia and the errors in huduh
  • 27. My rapeseed commodity chart prediction useful for day traders and others
  • 26. Problems problems and more problems
  • 25. stock chart signals and price action patterns - by Steve Sollheiser
  • 24. Malaysian property prices and the property market
  • 23. Malaysian population growth and Malaysian property prices
  • 22. False teachings of the muslim terrorist
  • 21. The alternative technical analysis for commodity and stock market analysis
  • 20. Malaysian property price, bubble and crash in 2012
  • 19. The basics of stock market, forex, commodity and financial economy models
  • 18. Gold price and business opportunities
  • 17. US Economic recovery and growth part 4
  • 16. US Economic recovery and growth part 3
  • 15. Gold price forecast trend chart 2011 2012 2013 2014 2015 2016
  • 14. US Economic Recovery and Growth Part 2
  • 13. US Economic Recovery 2009 2010 2011
  • 12. How to predict gold price trend 2011 2015
  • 11. Malaysian property prices and the property bubble
  • 10. Distribution of Wealth Model and Supply and Demand
  • 9. Gold price forecast 2011 2015
  • 8. Explanation of inflation and model of inflation hyperinflation
  • 7. Approximate silver price trend prediction chart june sept 2011
  • 6. how to predict stock and commodity trends
  • 5. Causes of economic crisis recession and high inflation or hyperinflation
  • 4. What is inflation and how to manage inflation
  • 3. Making sound investment decisions
  • 2. forecasting commodity and stock market trends
  • 1. Dr. Peters Loan Calculator
  •  
    « Gold price forecast 2011 2015
    Money cannot intoxicate but greed can
    - Dr. Peter Achutha, 18 July 2009
    Malaysian property prices and the property bubble »


    Distribution of Wealth Model and Supply and Demand

    In the previous article "Explanation of inflation and model of inflation hyperinflation" I had mentioned that

    r-q = I

    where,

    q = probability of transaction

    r = probability of replacement

    I = inflation

    This equation was derived from the demand side of the curve and r is the probability of replacement of customers. That is new customers are coming in every day to buy products as in consumer goods and services. q is the inherent probability of transaction within the market or economy and we could for the time being, for simplification purposes, say that it represent supply.

    Let us look at the model from this equation was derived from.  


    The Distribution of Wealth vs Supply and Demand

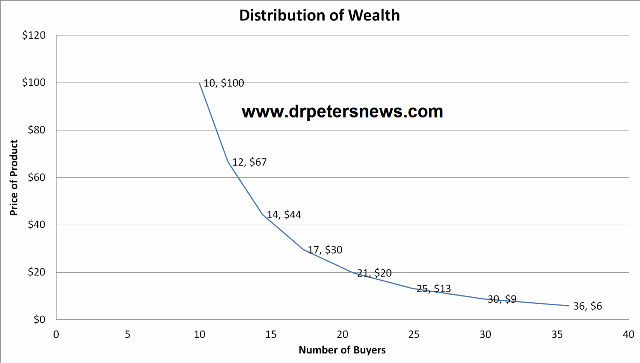
    If we measure how much money in a given population, an individual has to purchase a product it would be distributed according to the Distribution of Wealth chart shown below.


    An example of the Distribution of Wealth Model


    DOW640 Distribution of Wealth Model Supply and Demand
    DOW640 Distribution of Wealth Model Supply and Demand
    DOW640 Distribution of Wealth Model Supply and Demand
    DOW640 Distribution of Wealth Model Supply and Demand

    This is a fictitious chart and shown here as an example. From here you can observe how rich or poor a certain population is. You will observe that 10 people can afford to purchase a product at $100 but 30 people can afford to purchase a similar product at $9. Which group would you target? How much profit do you think you can make from any target group? Profitability would depend upon the cost of the product for that target market. For example the cost of manufacturing a Mercedes Benz would be very much higher than that of a Proton Saga. But it may be worthwhile looking at whether the Proton Saga should be stripped down and sold to the 36 people who could only afford $6 and some fixtures added to sell to the 25 people who could afford $13. Hence you can end up selling 25+30+36=91 cars per month or per year according to this example instead of trying to compete with Mercedes Benz to sell to 10 customers.  

    If you just focused on the 30 people who could afford $9 then after selling to the first 10 customers you will find that there are only 20 customers left. It would appear as if demand is dropping. In actual fact there is a rate of replacement of potential customers. Every month or day or year, 30 more customers walk in the door.  

    What is the initial probability of transaction for the $9 product? At first glance it looks like 30/165=0.18 where 165 is the total population. That is an 18% chance of selling to people selected at random. In actual fact the probability of transaction can be 129/165= 0.78 where 129 is the total population that can afford the product – including all people on the left of the $30 segment. This translates to 78% chance of selling to people selected at random. Which would be easier to sell, the $100 product or the $30 product?  

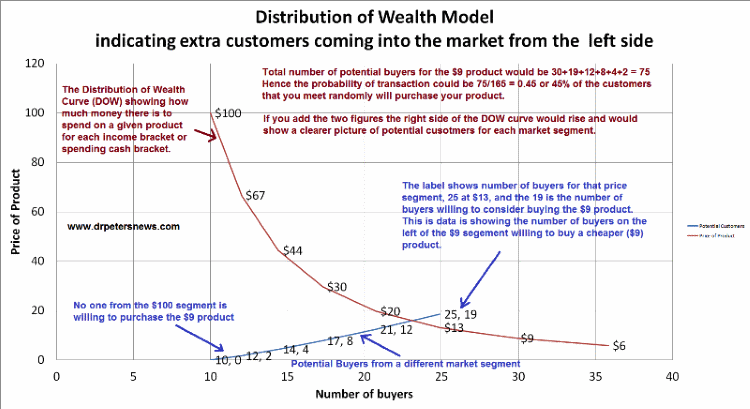
    If we considered the case where buyers on the left of the $9 market segment, that is buyers of more expensive products, are willing to purchase the $9 product then in the case shown in the chart below there would be 75 buyers for the $9 product. This indicates a probability of transaction of 0.45 or 45% of the people who walk into your door will purchase the $9 product.  


    DOWPotential800 Distribution of Wealth Supply and Demand
    DOWPotential800 Distribution of Wealth Supply and Demand
    DOWPotential800 Distribution of Wealth Supply and Demand
    DOWPotential800 Distribution of Wealth Supply and Demand

    Did you notice that the DOW curve indicates the total money supply into this market?

    The market or rather sales begin to oscillate when no new customers walk in the door. This is the Origin of Movements and the basic source of economic oscillations. When replacement customers walk in the door the market or sales becomes inflationary. That is the replacement customers are dampening the oscillations to inflationary behaviour.  


    Distribution of Wealth is not Demand Curve?

    Now you could say that the curve I have shown is a Demand Curve. It does look like a Demand Curve but the Distribution of Wealth model explains a lot more than a Demand Curve. Furthermore this curve is also the Supply Curve with different number of people as suppliers instead of buyers. And for these reasons this Distribution of Wealth model is an Alternative Theory to the conventional Supply and Demand curve.  


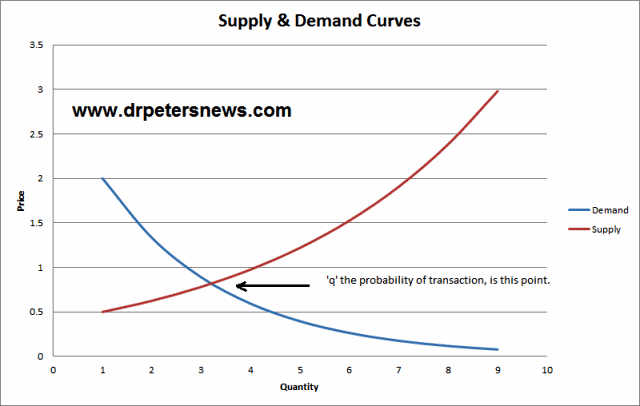
    Conventional Supply and Demand curve pitfalls

    Now, q the probability of transaction, should be the point, in conventional Economics, in the Supply and Demand chart, it is where the Demand curve cuts the Supply curve.


    Conventional Supply and Demand


    S&D Distribution of Wealth Model Supply and Demand
    S&D Distribution of Wealth Model Supply and Demand
    S&D Distribution of Wealth Model Supply and Demand
    S&D Distribution of Wealth Model Supply and Demand

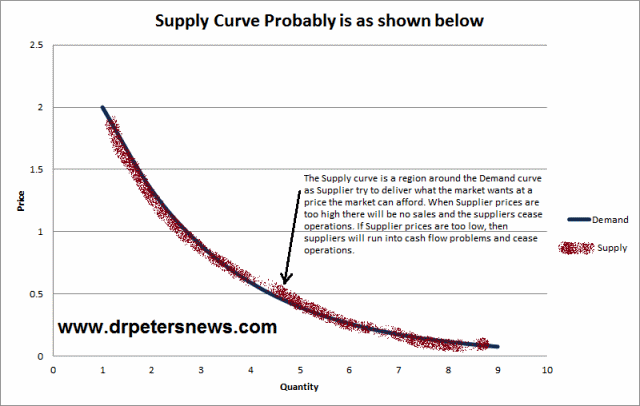
    As I was examining the conventional Supply & Demand curves my suspicions were aroused. Is this not quite right? For example, if I started a poultry farm supply eggs at a retail price of RM0.40 (USD$0.13) per egg, I would be competing with every other supplier and supplying eggs into the market. If I developed a RM100/- (USD$32.00/-) egg, the supply curve shows that there should be many many more suppliers trying to sell RM100/- eggs. But I do know from experience, that I have priced myself out of the market and no one would buy the RM100/- eggs. Eventually, my business will close and all the other suppliers that were trying to promote RM100 eggs would close too. In reality it does not happen. The Supply curve should probably look like, the chart shown below.  


    Conventional Supply and Demand curve pitfall


    S&DNoS Distribution of Wealth Model Supply and Demand
    S&DNoS Distribution of Wealth Model Supply and Demand
    S&DNoS Distribution of Wealth Model Supply and Demand
    S&DNoS Distribution of Wealth Model Supply and Demand

    This is where the 'Distribution of Wealth' model fits in. Not only can the 'Distribution of Wealth' model be used to represent Demand or Potential Demand but it does show how rich a population group is. Hence the Supply curve will be a region around the Demand Curve. That is, those suppliers who 'cling' closely to the Demand Curve Distribution will survive and succeed. Those suppliers whose products are priced 'way off' the Demand Distribution Curve will find it difficult to survive and fail and disappear from the 'conventional Supply curve' distribution.  

    Copyright (c) Dr. Peter Achutha, 2011 for this article "Distribution of Wealth Model and Supply and Demand"  - 22 July 2011

    Please do show me your appreciation of this article by Buying me a coffee.

    And do get the "I Won" t-shirt


    Copyright © 2013 - 2024 Peter Publishing - All Rights Reserved